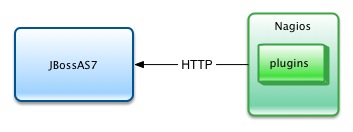
Recently I worked on a Nagios plugin for WildFly/JBossAS resource monitoring. The plugin is written in Python and uses HTTP-JSON based API (JBossAS REST Management API) to collect server statistics. The plugin currently supports standalone mode. Other available plugins need additional SAR or WAR to be installed on the application server. Typically in Enterprise setups; it is sometimes not allowed to perform any additional installations on the target system. The main advantage of this plugin is it leverages the REST API of JBossAS. This allows us to monitor the application server without any additional configurations and installations.
The plugin supports monitoring of following metrics:
JVM:
- Heap utilization
- Non Heap utilization
- Old Gen utilization
- Eden Space utilization
- Perm Gen utilization
- Code Cache utilization
- Avg. time for Major GC
- Avg. time for Minor GC
JMS:
- Queue Depth
Thread Pools:
- Daemon thread count
- Peak thread count
- Live thread count
Datasource:
- ActiveCount
- AvailableCount
- AverageBlockingTime
- AverageCreationTime
- CreatedCount
- DestroyedCount
- MaxCreationTime
- MaxUsedCount
- MaxWaitTime
- TimedOut
- TotalBlockingTime
- TotalCreationTime
Detailed documentation about Nagios configuration is available on https://github.com/aparnachaudhary/nagios-plugin-jbossas7.